A good exercise to start off with here... (1 Viewer)

Users who are viewing this thread

    crosswatt

    Well-known member
    Joined
    Feb 11, 2019
    Messages
    215
    Reaction score
    423
    Age
    51
    Location
    Virginia
    Offline

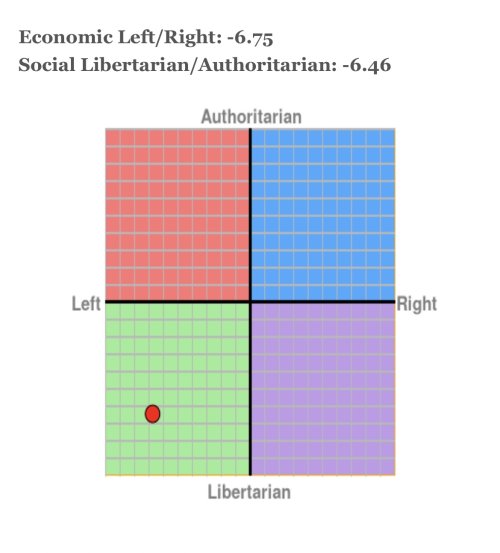
    We've done this before on the political discussion board, but it's always fun to see where our scores fit relative to what our feelings about where we fall on the political spectrum are. So everyone feel free to take it and share your results.
     
    I think this quiz is rigged to make people believe they are libertarians.

    I think most people have a good amount of belief in personal freedoms and that is what probably drives that. Where we tend to diverge is on economics, social issues, and national defense, which I think is what pushes the left and right sides of that spectrum.

    If you're on the left side of the spectrum a heck of a lot of your beliefs on social issues will lean strongly on the libertarian side of things. If you're on the right a heck of a lot of your beliefs on economics and corporate freedoms will. Either way, both sides probably have enough Strongly Agrees to tilt them on that side of the spectrum.
    yea, i guess maybe i only think it's biased towards libertarianism because we are all from western democracies, and I can't imagine anyone answering in a way that puts them in the authoritarian hemispere.

    If we had some Chinese, North Korean, or Saudi people take the quiz, they might have the same feeling about how anyone could end up in the libertarian half.
    We did get a fair range of responses and I put them onto one chart back when we were doing this originally:

    mapmap-20191007.png


    So some definite clustering, but still a fair spread from left to right, and it's actually quite a spread on the Y axis as well, it's just the range is from center to 'Libertarian'.

    Googling other group's results, there's generally a bit more of a spread into the authoritarian range, but still seems to generally be a bit of a skew (you get people right down near the bottom, not many right near the top), so I'd agree it could be a cultural thing. But it could also be the nature of the test perhaps, I wonder if authoritarianism could tend to emerge more in some people inclined that way in situations driven by particular circumstance, rather than in conscious principle, in which case they might test a lot more libertarian than they would act in reality.
    yea, if they added questions about things like vaccine and masking mandates, i would have probably skewed more authoritarian.
     
    personalised chart

    This is my result. I think I'm left of center, but closer to the middle between left and right than this depicts.
     
    Pew did a new quiz, with more categories, if anyone is interested:

     
    Pew did a new quiz, with more categories, if anyone is interested:

    I took it. Here's my results:

    Your best fit is…​

    Establishment Liberals​

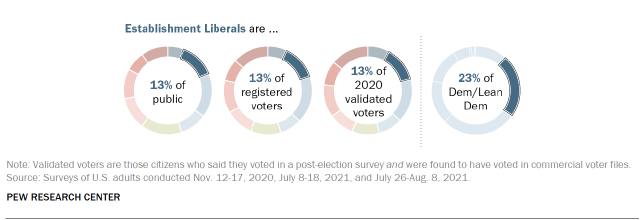
    … along with 13% of the public​


    10. Establishment Liberals​


    Liberal and racially and ethnically diverse, they stand out for their optimism and support for political compromise
    Chart shows Establishment Liberals are ...
    Holding liberal positions on nearly all issues, Establishment Liberals are some of the strongest supporters of the current president and the Democratic Party of any political typology group.
    While deeply liberal – roughly half describe themselves as either liberal (41%) or very liberal (12%) – Establishment Liberals are the typology group most likely to see value in political compromise and tend to be more inclined toward more measured approaches to societal change than their Progressive Left counterparts. Like other Democratic-oriented groups, most Establishment Liberals (73%) say a lot more needs to be done to ensure racial equality. Yet they are the only Democratic-aligned group in which a majority of those who say a lot more needs to be done also say this can be achieved by working within the current system.
    Establishment Liberals’ gender, age and racial and ethnic profile generally parallels that of the Democratic Party as a whole: They comprise more women than men (53% vs. 46%) and more are under the age of 50 than 50 and older. About half of Establishment Liberals (51%) are White, while 18% are Black, two-in-ten are Hispanic and one-in-ten are Asian.
    Establishment Liberals are one of two typology groups in which nearly half (47%) have college degrees (a quarter have postgraduate degrees). About one-in-five (23%) live in upper-income households, a higher share than in any other Democratic-oriented typology group.
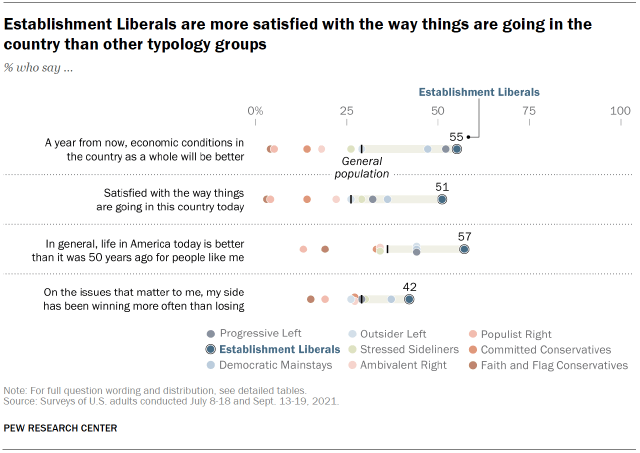
    Establishment Liberals stand out for their current satisfaction with the direction of the country and optimism about the future. Roughly half (51%) say they are satisfied with the way things are going in the country today, compared with 36% of Democratic Mainstays and even smaller shares in other typology groups.

    Establishment Liberals: Political affiliation, voting and engagement​

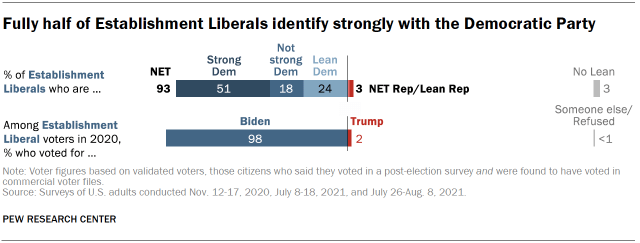
    Chart shows fully half of Establishment Liberals identify strongly with the Democratic Party
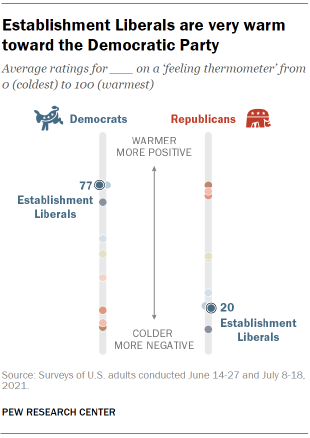
    Chart shows Establishment Liberals are very warm toward the Democratic Party
    An overwhelming majority of Establishment Liberals either identify with or lean toward the Democratic Party. About half say they strongly identify with the Democratic Party (51%), 18% identify as Democrats but not strongly and about a quarter (24%) lean toward the Democratic Party.
    Establishment Liberals feel quite warmly toward the Democratic Party. On a “feeling thermometer” ranging from 0 to 100, where 100 represents the warmest, most positive feelings, Establishment Liberals give Democrats an average rating of 77, identical to the average rating among Democratic Mainstays and higher than any other group. Establishment Liberals are also fairly cold toward Republicans, giving them an average rating of just 20.
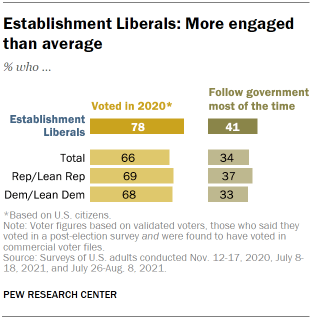
    Chart shows Establishment Liberals: More engaged than average
    An overwhelming majority of Establishment Liberals approve of Joe Biden’s job performance as president as of mid-September, including six-in-ten who strongly approve. And about eight-in-ten Establishment Liberals (83%) say they approve of the job Democratic leaders in Congress are doing, 11 percentage points higher than the share who say this in any other group.
    This group is highly politically engaged, though somewhat less so than the two most engaged groups (the Progressive Left and Faith and Flag Conservatives). Establishment Liberals vote at higher rates than many other groups: 78% of those eligible cast ballots in 2020, which is 12 percentage points higher than the general population and 10 points higher than Democrats and Democratic leaners overall.
    About four-in-ten (44%) say they follow what’s going on in government and public affairs most of the time.
    At the start of the 2020 Democratic primaries, Biden was the first choice of about three-in-ten Establishment Liberals, with substantial shares of Establishment Liberals also supporting Sens. Elizabeth Warren (17%) and Bernie Sanders (16%), as well as then-Mayor Pete Buttigieg (10%).

    Establishment Liberals: Key political attitudes and beliefs​

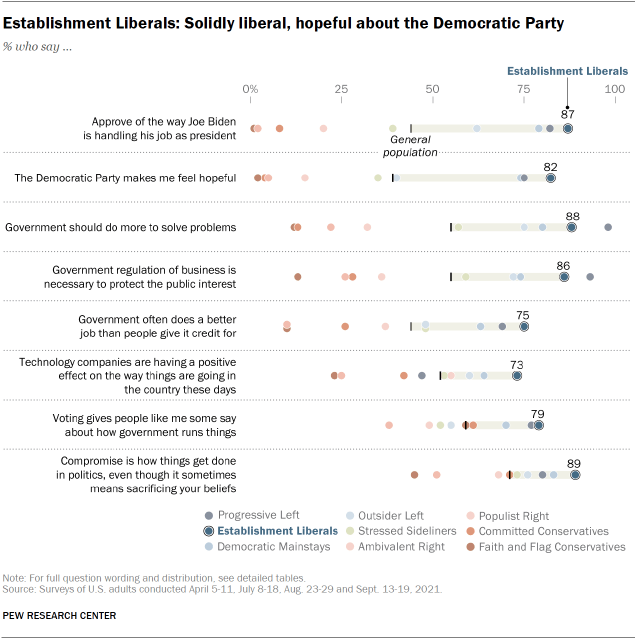
    On many dimensions, particularly views about the role of government in society, Establishment Liberals are second only to Progressive Left in the uniformity of their liberal positions.
    Chart shows Establishment Liberals: Solidly liberal, hopeful about the Democratic Party
    About eight-in-ten Establishment Liberals (83%) say they favor a bigger government providing more services, though in contrast to their Progressive Left counterparts they are more likely to say that government services should be modestly – as opposed to greatly – expanded. Overwhelming majorities in this group also say that government should do more to solve problems (88%), that government regulation of business is necessary to protect the public interest (86%) and that government often does a better job than people give it credit for (75%).
    Nearly nine-in-ten Establishment Liberals (89%) say that compromise is how things get done in politics, higher than the share in any other political typology group. And about eight-in-ten (82%) say the Democratic Party makes them feel hopeful, which is the highest share of any group.

    Establishment Liberals are upbeat about the country​

    Establishment Liberals are more optimistic about the country and its future than other political typology groups. They are more likely to say they are satisfied with the way things are going and to approve of Biden, and their relatively positive views extend to other attitudes as well.
    Chart shows Establishment Liberals are more satisfied with the way things are going in the country than other typology groups
    Establishment Liberals are the only group in which a majority (57%) now say that life in America is better today than it was 50 years ago for people like them. Establishment Liberals also view current economic conditions more positively than those in other typology groups: 48% say that conditions are either excellent (3%) or good (45%), compared with no more than about a third of any other group. And they have a more positive economic outlook than most other groups: 55% say the economy will be better a year from now.

    Establishment Liberals: Who they are​

    Establishment Liberals are one of the two most educated typology groups, alongside the Progressive Left. Members of this group are 15 percentage points more likely than U.S. adults overall to have a college degree, and 11 points more likely to have a postgraduate degree. They are also among the most well-traveled typology groups. Nearly two-in-ten (19%) say they have visited 10 or more countries outside the United States.
    Establishment Liberals are quite similar to U.S. adults overall in terms of age: 19% of this group are between the ages of 18 and 29, 34% are ages 30 to 49, 24% are 50 to 64, and 23% are 65 and older. This typology group is roughly tied for the second highest share of Black adults of any typology group (18%, compared with 15% of Outsider Left, though both trail the 26% of Democratic Mainstays) and is tied with the Outsider Left for the highest share of Asian adults (10%). About half of this group (51%) are White adults and 20% are Hispanic adults.
    Nearly nine-in-ten Establishment Liberals (88%) said they had received all of the necessary shots to be fully vaccinated against COVID-19 as of August 2021, the second-highest share of any group after the Progressive Left. And about two-thirds of Establishment Liberals (68%) report getting political news from CNN in a typical week, making the cable network their most-used source out of 26 major outlets asked about in March 2021.

    Next: 11. Progressive Left
     
    Last edited:
    Never thought I'd be considered a "Democratic Mainstay" but that's how I graded out on the questions asked.

    And that's along with 16% of the public.
     

    Your best fit is…​

    Progressive Left​

    … along with 6% of the public​


    Progressive Left, the only majority White, non-Hispanic Democratic-oriented political typology group, have very liberal views on virtually every issue and support far-reaching changes to address racial injustice and expand the social safety net. They are among the smallest typology groups, but also one of the most politically engaged. They feel less warmly toward the Democratic Party than Establishment Liberals or Democratic Mainstays, but those who voted in the 2020 general election were nearly unanimous in their support for Joe Biden. They are the only group in which a majority say they like political leaders who identify as democratic socialists.
     

    Your best fit is…​

    Outsider Left​

    … along with 10% of the public​


    We've done this before on the political discussion board, but it's always fun to see where our scores fit relative to what our feelings about where we fall on the political spectrum are. So everyone feel free to take it and share your results.
    chart
     

    Create an account or login to comment

    You must be a member in order to leave a comment

    Create account

    Create an account on our community. It's easy!

    Log in

    Already have an account? Log in here.

    General News Feed

    Fact Checkers News Feed

    Back
    Top Bottom